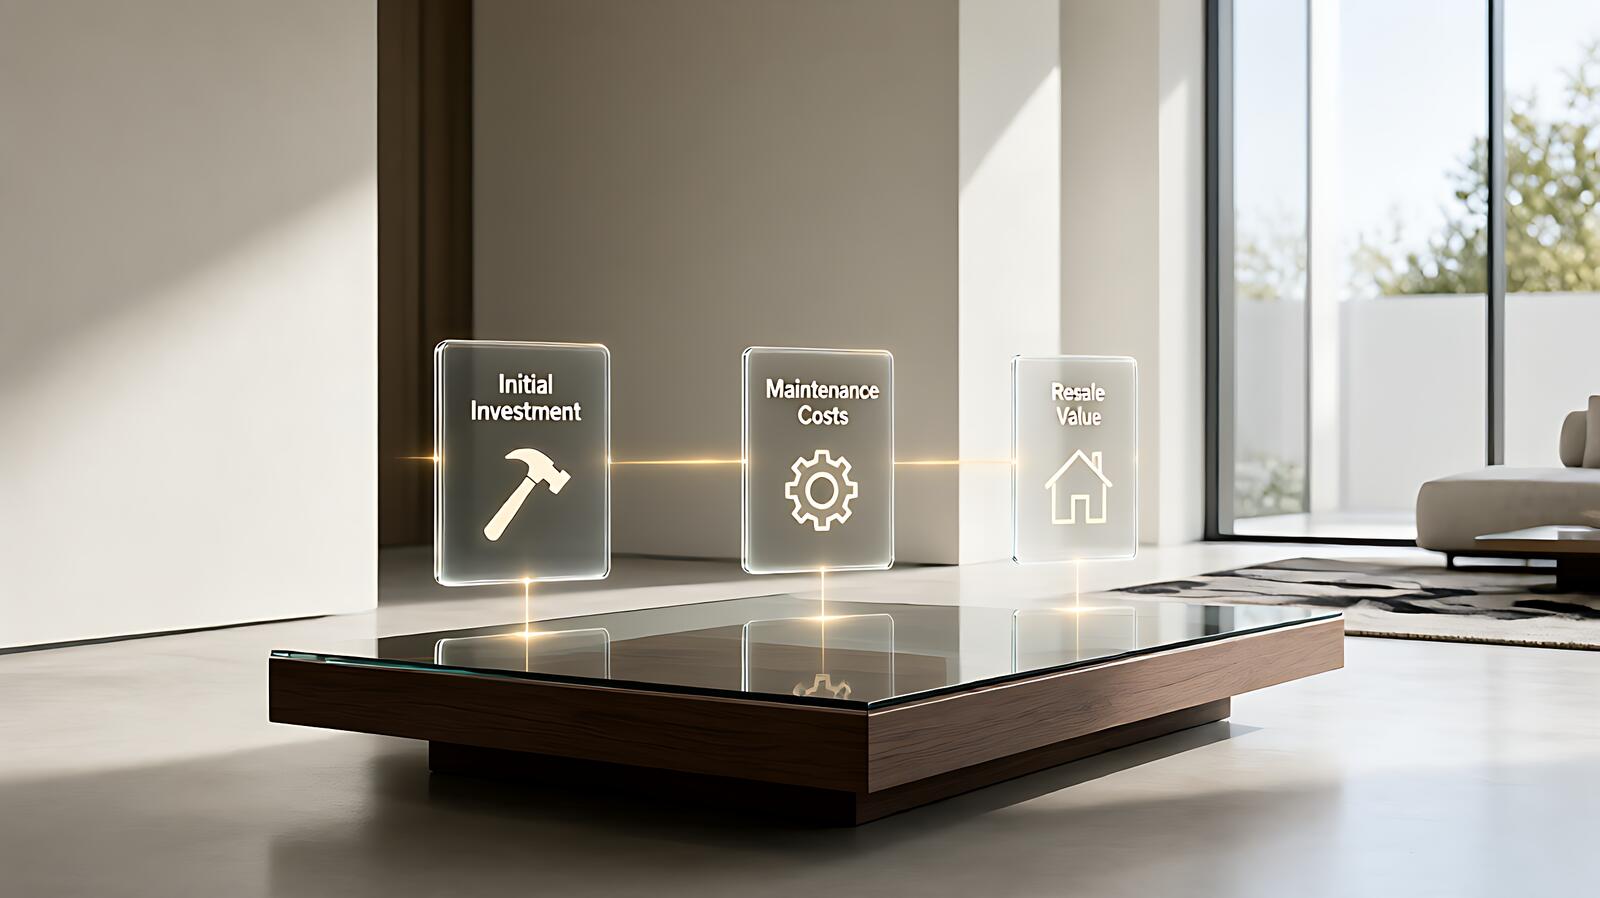

Two quotes for the same kitchen renovation: $35,000 and $52,000. The gap is not contractor markup. It is lifecycle cost, and the cheaper quote usually carries the higher one over 20 years. A lifecycle cost breakdown separates what you pay today from what you pay over the life of the project, so you can see which number is real.
Most homeowners compare quotes line by line. That comparison misses the point. A $35,000 kitchen with builder-grade cabinets and a $52,000 kitchen with semi-custom cabinets are different products with different lifespans, maintenance schedules, and resale impacts. The breakdown below shows where the money goes and which line items actually drive the difference.
What a Lifecycle Cost Breakdown Actually Shows
A lifecycle cost breakdown splits every dollar into five buckets. Each bucket has a different weight depending on the system, and seeing the weights changes how you read a quote.
Initial cost is the one on the estimate: materials, labor, permits, and disposal. It is the largest single number but rarely the largest lifetime number. Operating cost covers energy, water, and consumables over the service life. Maintenance cost is scheduled upkeep: annual service, sealant renewal, filter replacement, and minor adjustments.
Repair cost is the unpredictable bucket. It covers failures that happen between maintenance visits. Replacement cost is what you pay when the system reaches end of life and you start over. Add all five, divide by service life, and you have annualized cost. That is the number you should compare.
The breakdown matters because the buckets are not equal. For a roof, initial cost is 60% of lifetime cost. For an HVAC system, operating cost is 50%. For a water heater, replacement cost dominates because service life is short. Knowing which bucket matters most tells you where to spend and where to save.
How to Build a Lifecycle Cost Breakdown for Any Project
Start with the quote. Pull every line item and assign it to one of the five buckets. Most quotes are 80% initial cost and 20% everything else. The rest you estimate.
Step one: set the service life. Use the conservative end of the manufacturer range. A builder-grade roof is 15 years, not 20. A mid-grade is 25, not 30. Write the number down because every other calculation depends on it.
Step two: estimate annual operating cost. Use your actual utility bills for the past 12 months. If you are comparing two systems, look up the efficiency rating and calculate the difference. A 96% AFUE furnace versus an 80% AFUE furnace saves roughly $200 per year on a $1,000 heating bill.
Step three: estimate annual maintenance. Ask the installer what the annual service visit costs. Add consumables like filters, sealant, and cleaners. For most systems this is $50-200 per year.
Step four: estimate annual repair. Use 1-2% of initial cost per year for systems under half their service life. Use 3% for systems past half. A $10,000 HVAC system budgets $100-200 per year in repairs for the first 7 years and $300 after that.
Step five: calculate annualized cost. Divide initial cost by service life. Add annual operating, maintenance, and repair. Compare two options on that number. The option with the lower annualized cost is the better lifecycle value, even if the quote is higher.
For a worked example of this calculation across real systems, see our guide to home maintenance lifecycle cost.
Where the Money Goes in a Typical Home Renovation
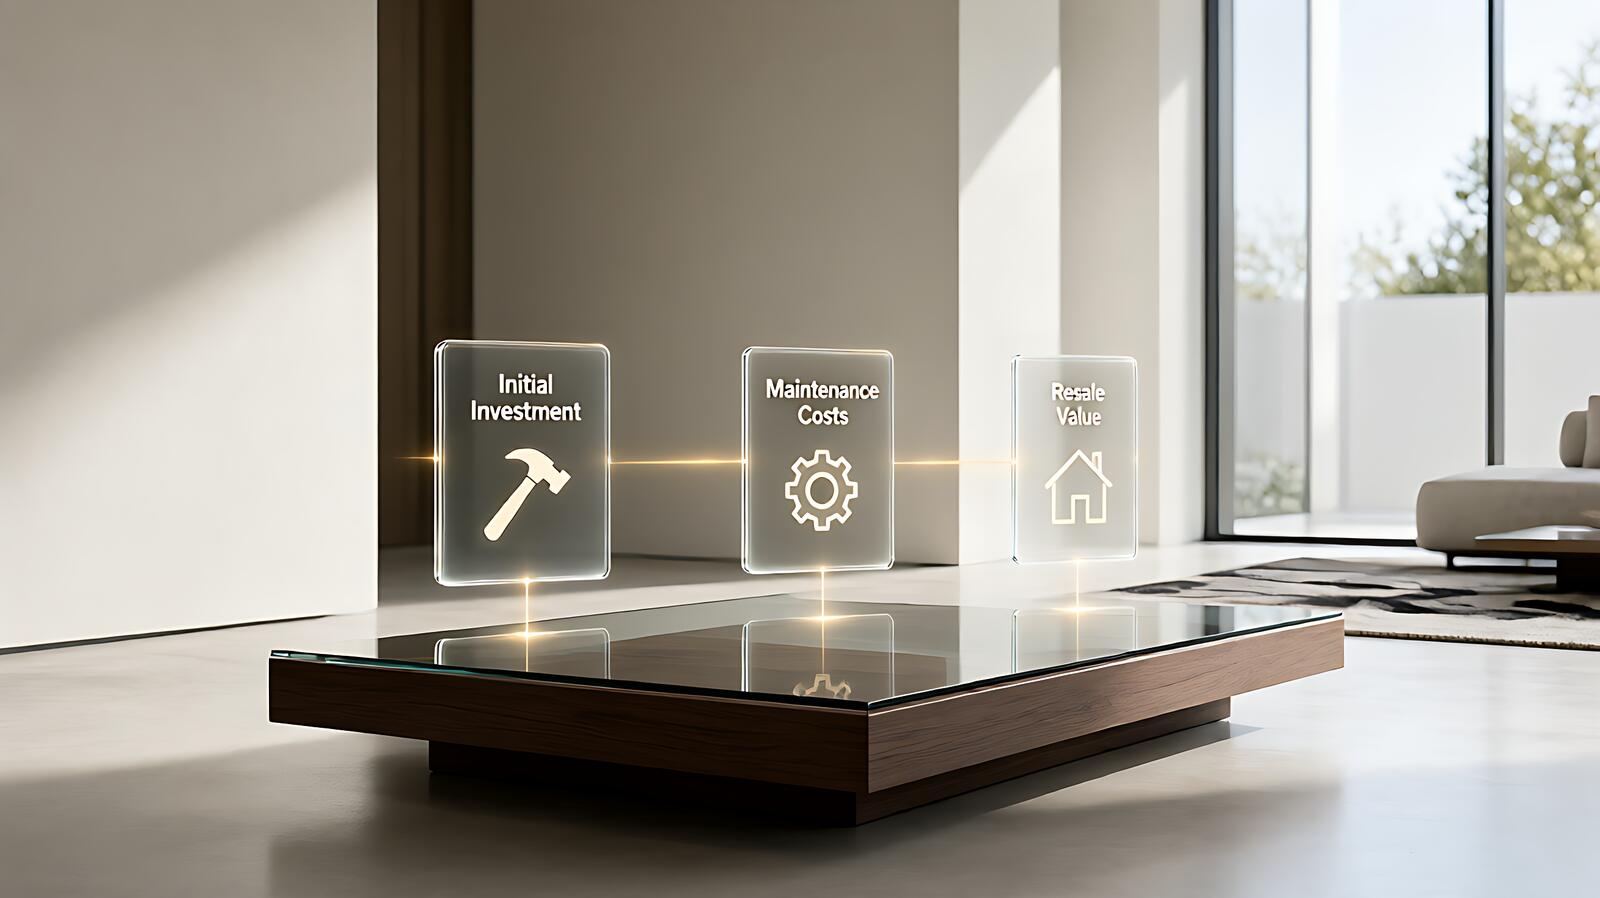
Labor is 40-60% of most renovation quotes. Materials are 30-45%. Permits and disposal are 5-15%. Those proportions hold across kitchens, bathrooms, and basements. What changes is the lifecycle weight of each line item.
In a kitchen renovation, cabinets are 30-40% of the quote. Builder-grade cabinets last 10-15 years. Semi-custom last 20-25 years. Custom last 30-40 years. The $8,000 difference between builder and semi-custom spreads over 10 extra years, making the annualized difference $800 per year. That is often less than the maintenance cost difference.
Countertops are 10-15% of the quote. Laminate lasts 10-15 years. Quartz lasts 25-30 years. Granite lasts 30-50 years. The lifecycle cost of quartz is often lower than laminate because the replacement cost is avoided entirely in a 25-year ownership window.
Flooring is 10-20% of the quote. Hardwood lasts 50-100 years with refinishing. LVP lasts 15-25 years. Tile lasts 50+ years. The cheapest flooring is rarely the lowest lifecycle cost because replacement labor is expensive and disruptive.
Appliances are 10-15% of the quote. A $2,000 refrigerator with 12-year life costs $167 per year. A $4,000 refrigerator with 18-year life costs $222 per year. The cheaper one wins on annualized cost unless the expensive one saves $60 per year in energy.
For practical ways to lower these costs across your whole project, read our guide on reducing home improvement lifecycle cost.
How to Compare Two Quotes Using Lifecycle Cost
Take two quotes for the same scope. List every line item side by side. The differences usually fall into three categories: material grade, labor quality, and scope completeness.
Material grade differences are the easiest to quantify. A quote with 3-tab shingles versus architectural shingles has a $2,000 gap. The architectural shingles last 10 years longer. Annualized difference: $200 per year. If the operating cost is the same, the architectural shingles are cheaper over 25 years.
Labor quality differences are harder to see but more important. A cheaper labor rate often means less experience, which means more callbacks, longer timelines, and higher repair costs. Add 10-20% to the repair estimate for the lower-bid contractor. That often erases the upfront savings.
Scope completeness differences are the most dangerous. A quote that excludes permit fees, disposal, or finish work is not cheaper. It is incomplete. Add the missing items before comparing. A $30,000 quote that excludes $3,000 in permits is actually a $33,000 quote.
After adjusting for all three, calculate annualized cost for each. If the difference is under 10%, choose based on contractor reputation, timeline, and warranty. If the difference is over 20%, the lower annualized cost is the right choice.
Common Mistakes in Lifecycle Cost Breakdowns
The first mistake is using the same service life for all material grades. A builder-grade and a premium product do not last the same number of years. If you use 25 years for both, the premium product looks overpriced. Use the actual rated life for each grade.
The second mistake is ignoring escalation. Energy costs rise 2-4% per year. A system that saves $200 in year one saves $280 by year ten. Flat-price calculations understate efficiency upgrades by 20-30% over a 15-year horizon.
The third mistake is treating repair costs as linear. A roof does not fail evenly. Years 1-10 have near-zero repair cost. Years 11-15 have rising costs. Years 16-20 have accelerating costs. Model repairs as a curve, not a flat line. A simple way: use 0.5% of initial cost for the first half of service life and 2% for the second half.
The fourth mistake is forgetting the cost of money. A dollar spent today is more expensive than a dollar spent in 10 years. Discount future costs by 3-5% per year to account for this. A $10,000 replacement in year 15 is worth $4,800 in today’s dollars at a 5% discount rate.
The fifth mistake is overcomplicating the analysis. A 50-year model with 12 variables is less useful than a 15-year model with 4 variables. Match the complexity to the decision. Use 4 variables for appliances, 6 for systems, and 8 for whole-house projects.
What to Do With Your Lifecycle Cost Breakdown
Take the breakdown to your contractor. Ask which line items drive the difference between their quote and a competitor’s. A good contractor can explain why their cabinets cost more and what that means for durability.
Then ask about the items with the highest annualized cost. Those are the ones worth upgrading. A $500 upgrade that saves $50 per year for 20 years is a 10% annual return. Few investments beat that.
Finally, use the breakdown to set your renovation budget. Allocate more to items with high annualized cost and less to items with low annualized cost. This is how you stretch a $50,000 budget to perform like a $70,000 budget over 20 years.
Document the assumptions. Service life, energy prices, and repair rates are estimates. Write them down so you can revisit the calculation when conditions change. A lifecycle cost breakdown is a living document, not a one-time exercise.